Salesforce is an excellent tool for managing data, but it’s also powerful for creating reports that help you understand your business. Reports allow you to analyse your data, spot trends, and make informed decisions. This step-by-step guide will help you create your first report in Salesforce and customise it to meet your needs.
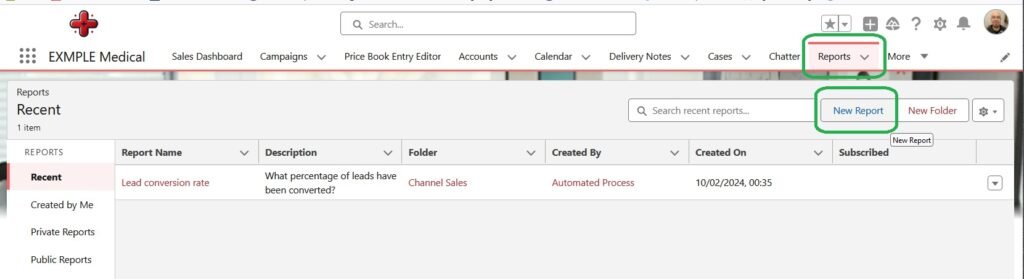
Step 1: Access the Reports Tab
To get started, log in to Salesforce and locate the Reports tab at the top of your screen. If you don’t see it, click on the App Launcher (the grid icon in the top-left corner), search for “Reports,” and select it from the results.
Step 2: Click “New Report”
Once you’re in the Reports tab, click the New Report button. This will open the Report Builder, where you can design your report.
Step 3: Select a Report Type
Salesforce will prompt you to choose a Report Type. A report type determines which data you can include in your report. For beginners, it’s best to select a standard report type, such as:
- Accounts and Contacts: To view data about companies and the people associated with them.
- Opportunities: To analyse your sales deals.
- Cases: To track customer support requests.
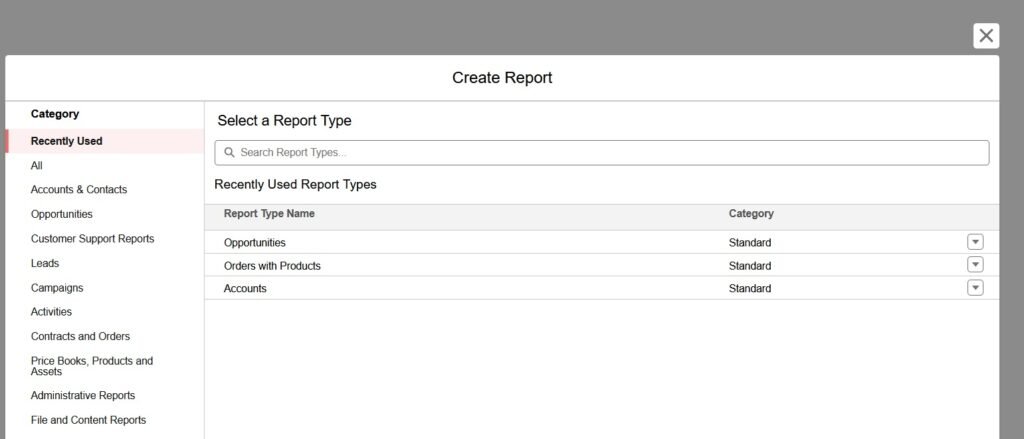
Select the report type that best matches the data you want to analyse and click Continue.
Step 4: Add Filters to Refine Your Data
Once you’re in the Report Builder, you’ll see a preview of your report and options to customise it. Start by adding filters to focus on the data that matters most. For example:
- Use the Show Me filter to specify which records to include (e.g., My Opportunities or All Opportunities).
- Adjust the Date Range filter to view data from a specific time period.
Filters help ensure your report only includes relevant information.

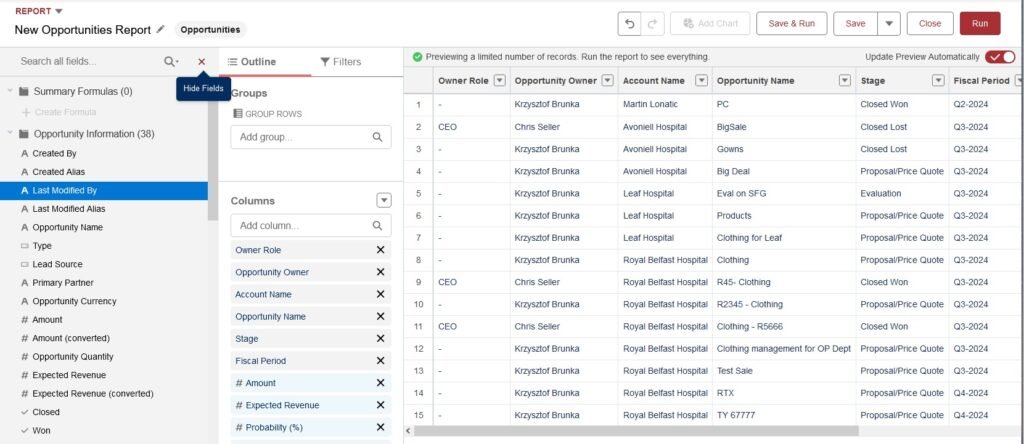
Step 5: Choose and Organise Fields
Fields are the pieces of information displayed in your report, such as Account Name, Contact Email, or Opportunity Amount. To add or rearrange fields:
- Click on the Add Column button or drag fields from the sidebar into the preview area.
- Rearrange columns by dragging them to your preferred order.
- Remove unwanted fields by clicking the X next to the column name.
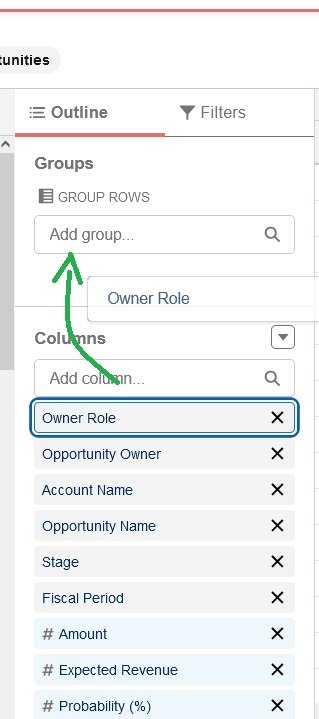
Step 6: Group Your Data
Grouping data helps you organise it into meaningful categories. For example, you can group opportunities by stage or accounts by region. To group your data:
- Drag a field (e.g., Stage) into the Group Rows area in the Report Builder.
- For additional grouping, drag another field into the Group Columns area.
Your report will update to show data grouped by these categories.
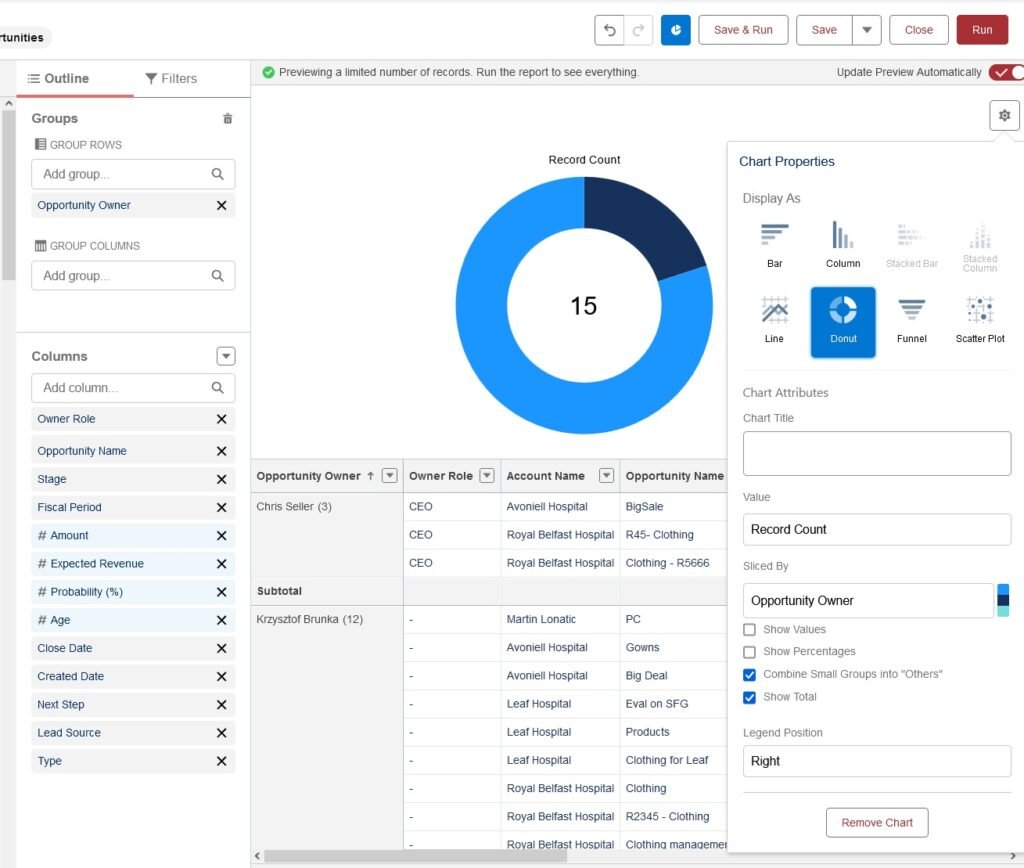
Step 7: Add a Chart (Optional)
Visualising your data can make it easier to understand. To add a chart:
- Click the Add Chart button in the Report Builder.
- Choose a chart type, such as bar, line, or pie chart.
- Customise the chart to highlight key metrics.
Step 8: Save Your Report
Once you’re happy with your report, click the Save & Run button. You’ll need to provide:
- Report Name: A clear and descriptive title for your report.
- Report Folder: Where your report will be stored. Choose a folder accessible to the appropriate users.
After saving, your report will run, and you’ll see the final version. Once run – you can export it to Excel, if required or share it with other users.
Final Thoughts
Creating your first report in Salesforce is straightforward once you know the steps. With practice, you can explore more advanced options, like cross-filters and formulas, to get even more insights from your data.
If you need help setting up reports or customising Salesforce for your business, contact IntegraLogic for a free consultation. We’re here to help you make the most of Salesforce!